Spectroscopy adapter
The UK amateur Robin Leadbeater was very kind and introduced me to the use of a 100 lines/mm transmission grating. I suggest you visit his site for a lot of detailed and useful information. I also higly recommend Tom How's pages on the same subject, where a detailed description is given on how to produce spectrum graphs from webcam captures via the 100 l/mm grating and free software.
I thought about how to mount the grating with my C8 quite a bit... Finally, I chose to use the female SCT-threaded ring that came with the T-adapter of my 0.33x Meade focal reducer. Instead of the standard inner T-shaped half of this ring, I made an aluminium ring and slightly smaller plexiglass shims. These were screwed to a wooden ring using wood screws. The SCT ring then is free to move as usual, but held in place by the aliminium ring.
The grating holder is 2 aluminium plates. The front plate is screwed to the wooden ring using wood screws. The back plate is screwed to a second wooden ring, which has just the right outer radius to allow a 10mm M42 extension ring to be screwed onto it. The grating goes between the aluminium plates of course. The camera can be screwed onto the back M42 extension ring.
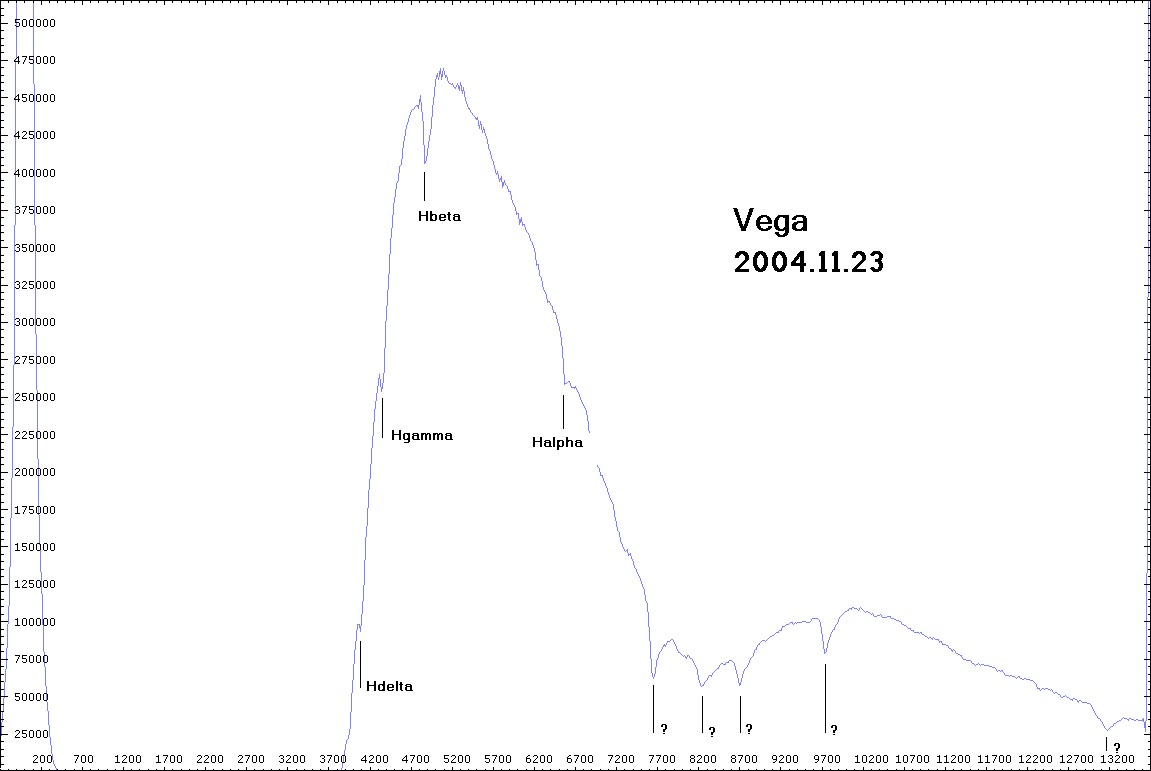
Some absorbtion lines can be recognised (Halpha, Hbeta, ... etc.). There are also some lines in the higher wavelength area that I suspect may be atmospheric absorbtion lines, but I don't know enough about it to be sure. Click the image for a full size graph.